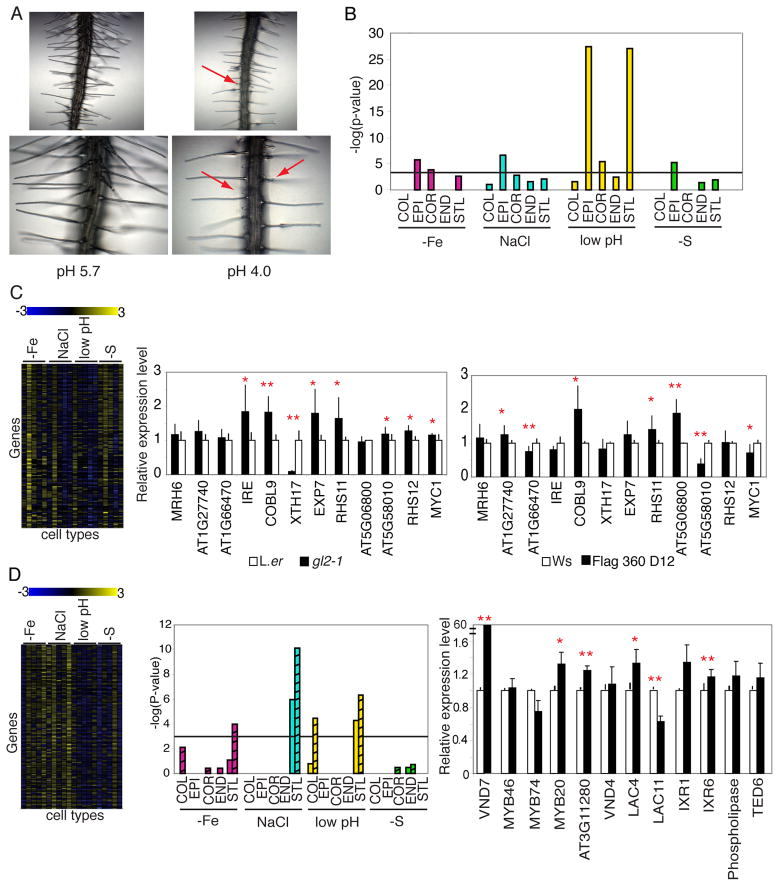
Figure 5. Cell-type stress data reveals components of development-associated transcription networks.
A) Root hair development is altered under low pH. Red arrows point to short, swollen root hairs. B) Root hair marker genes are enriched in the epidermis under each stress. Black line marks P < 0.001. C) Root hair cluster with enrichment (P = 9.66 × 10−40) of root hair marker genes. Left, heat map showing fold change of expression for genes in the cluster for all cell types under each stress. Cell types are arranged as COL, EPI, COR, END, STL for each stress. Middle and right, qRT-PCR of selected genes in the root hair cluster in the gl2 mutant (middle) or AT5G58010 T-DNA insertion line (right). D) Secondary cell wall biosynthesis cluster. Left, heat map with fold change of genes under each stress (cell type listed as in C). Middle, secondary cell wall biosynthesis genes are enriched in the STL in three stresses. Striped bars = genes identified from Persson et al. 2005; non-striped from Brown et al. 2005. Right, qRT-PCR of selected genes in this cluster in 35S::VND7. * = P < 0.05; ** = P < 0.01; one-tailed t-test. Error bars denote standard error.

