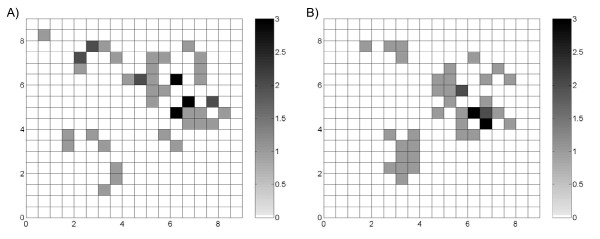
Figure 2.
Maps of the simulated case count Y(s) under the A) Poisson assumption and B) uniform assumption. Under the Poisson assumption, the observed cases are drawn from a Poisson distribution. Under the uniform assumption, the observed cases are derived from the product of the latent rate and population size. In both realizations, the values of Y(s) ranged from 0 to 3 cases.

