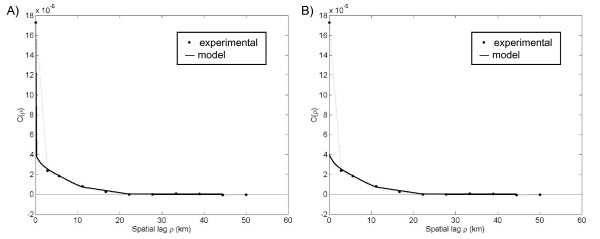
Figure 7.
Plots of the experimental rate covariance with covariance models for the North Carolina HIV data. The experimental covariance indicated a spatial neighborhood of influence extending less than 20 kilometers from each location. The nugget component of the A) observed rate field R(s)-covariance model was removed to obtain the B) X(s)-covariance model.

