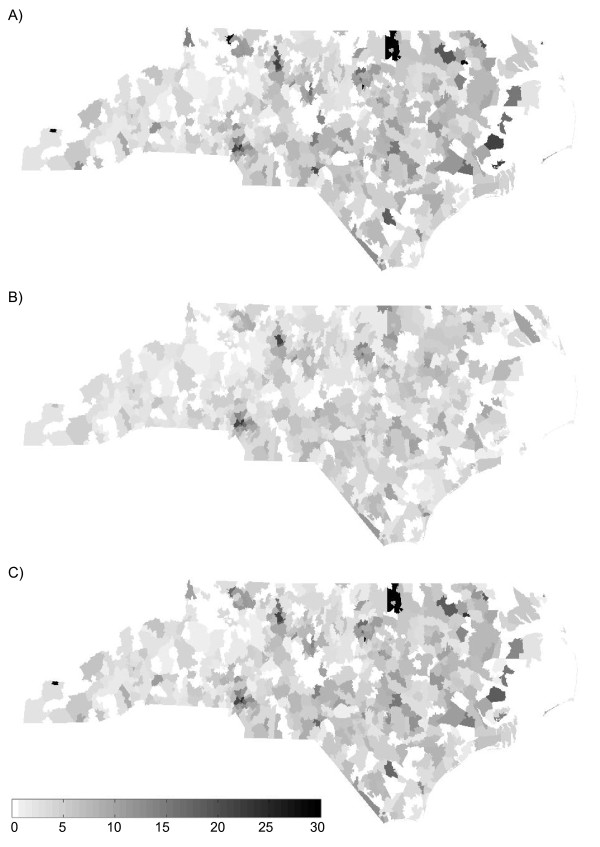
Figure 8.
Maps of the North Carolina HIV A) observed, B) Poisson kriging estimated, and C) UMBME estimated rates. While the Poisson kriging and UMBME maps displayed nearly identical spatial distributions of non-zero values, Poisson kriging exhibited greater smoothing strength than UMBME, thereby providing less distinction between areas of high and low rates (cases per 1,000 tests).

