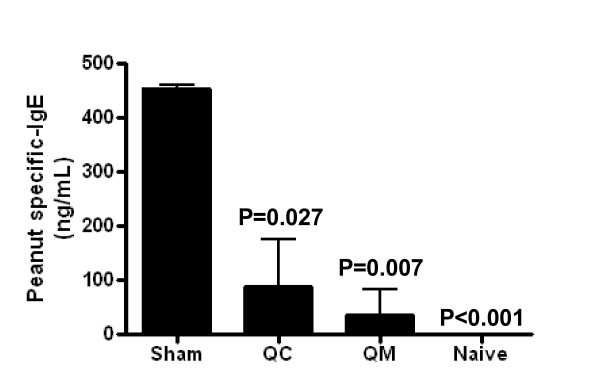
Figure 4.
Effect of QC and QM treatment on IgE production in vivo. Blood from each group of mice was collected one week before challenge. Peanut-specific IgE was measured by antigen-specific ELISA. Results are expressed as means ± SD of triplicates for each group (pooled samples; n = 5-8) P values are calculated vs sham.

