Figure 1.
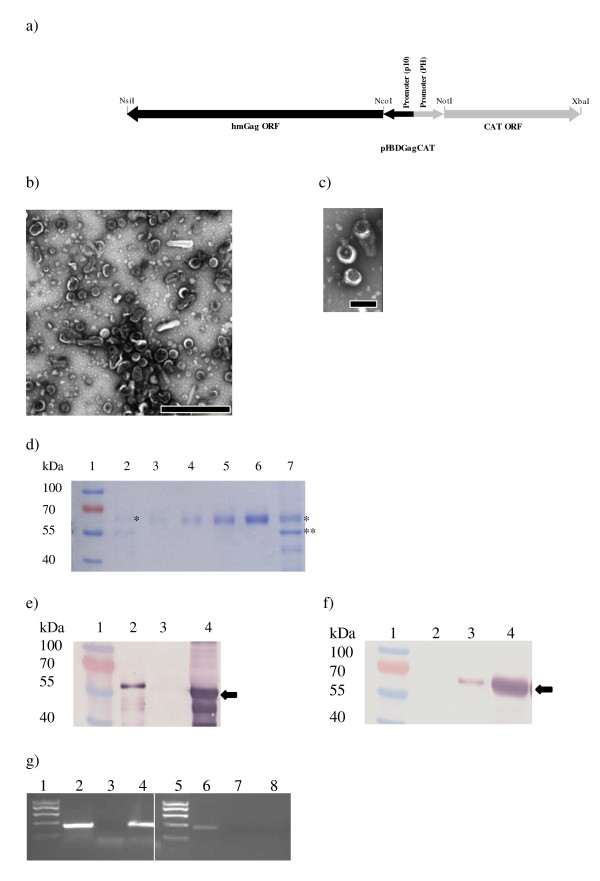
VLP isolation and quantification. a) Schematic diagram of pFBDGagCAT showing the Gag and CAT open reading frames under the control of the p10 and pH promoters, respectively. (b) Transmission electron micrograph of purified GagCAT VLPs. Arrows indicate typical doughnut-shaped VLPs (120 - 150 nm in diameter). Scale bar = 1000 nm. (c) Transmission electron micrographs of Gag VLPs after heating at 62°C for 20 minutes. Scale bar = 200 nm. (d) Coomassie-stained 10% SDS polyacrylamide gel used to densitometrically quantify Gp64 on in Gag VLP preparations. Lane 2 contains the Gp64 positive control (*), while lanes 3-6 contain dilutions of BSA at 100, 200, 500 and 1000 ng, respectively. Lane 7 contains Gag VLPs containing 1000 ng of Gag, showing gp64 (*) and GagPr55 (**). (e) and (f) Comparative western blots of purified VLP extracts probed with anti-Gag primary antibody (e) and anti-Gp64 primary antibody (f): Lane 2 - HIV-1 p17/p24 C clade protein standard (ARP695.2); Lane 3 - Gp64 positive control; Lane 4 - Purified GagCAT VLPs. Black arrows indicate the position of the 55 kDa HIV Gag (e) and 64 kDa VSV Gp64 (f) proteins, respectively. (g) 1% agarose gel showing DNA fragments generated by RT-PCR (lanes 2-4) and PCR (lanes 6-8) of GagCAT VLPs using CAT-specific primers. Lane 1 - molecular weight marker; Lanes 2 and 6 - 350bp positive control fragments generated using in vitro-transcribed CAT RNA and CAT DNA for RT-PCR and PCR, respectively; Lanes 3 and 7 - result of negative control experiments generated by RT-PCR and PCR of Gag VLP RNA extracts, respectively; Lanes 4 and 8 - results of RT-PCR and PCR using GagCAT VLP RNA extracts, respectively.

