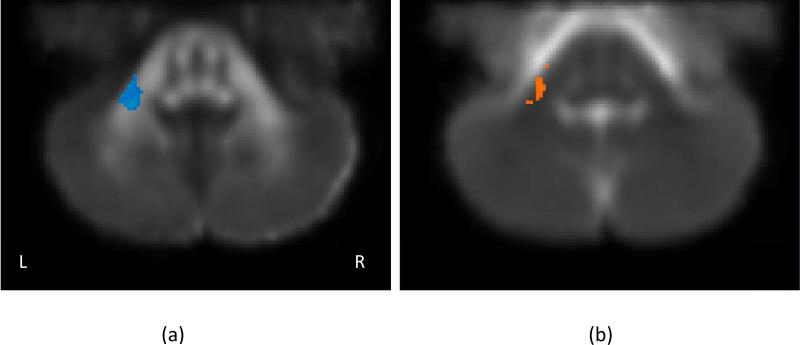
Figure 1.
ROIs consisting of at least 84 contiguous voxels at which the exposed and control groups differed at p < 0.01 (corrected). (a) FA – fractional anisotropy, and (b) λ⊥ – perpendicular diffusivity. No differences were noted for mean or parallel diffusivity. Blue indicates lower values for the alcohol-exposed children; orange indicates lower values for the controls. The grayscale image corresponds to the mean template.

