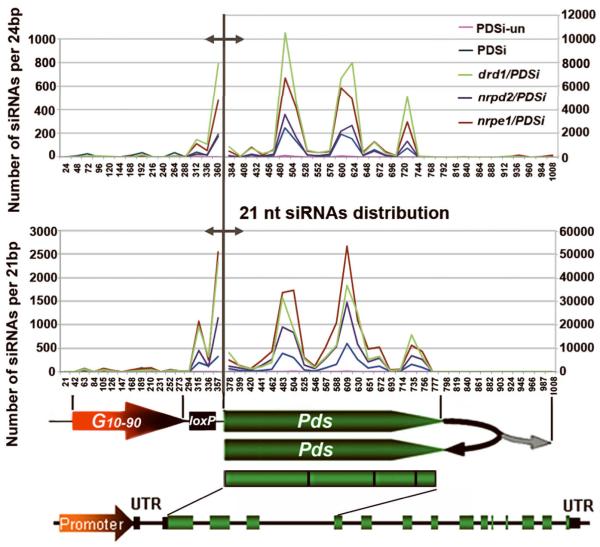
Figure 5. Distribution and comparison of 21- and 24-nt siPds obtained by deep sequencing in different genotypes.
Total miR159 reads obtained by deep sequencing from each genotype library was first normalized to PDSi-un’s miR159 counts to set the miR159 value for each genotype library. Total counts of siPds from each genotype were then normalized to its own miR159 value. Regions along the G10-90-loxP-Pdsi (1030 bp) with sequence identity to siPds was divided into 42 sections of 24 bp (upper panel) or 48 sections of 21 bp (lower panel) for counting number of siPds per 24bp or 21bp. Different Y axes represent number of siPds matched to the promoter region (left of the gray demarcation line) or the transcribed region (right of the gray demarcation line) related to position indicated in X axes. Structures of G10-90-loxP-Pdsi and the endogenous PDS gene are shown below to indicate the source of siRNA.

