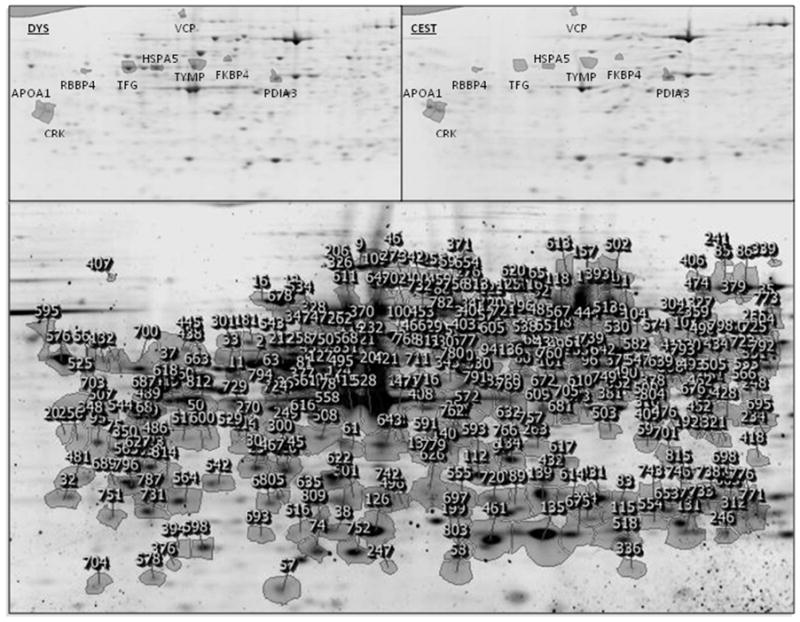
Figure 1.

2-DE reference gel image for all cGCT specimens showing protein spot number assignments (bottom). Expanded views of protein spot boundaries for all cGCT specimens, labeled by their gene symbols as shown in Table 1, are shown for proteins that are up-regulated in DYSs vs. cESTs (top left panel) and CESTs vs. DYSs (top right panel). Top-ranked proteins were identified by unbiased cLC/MS/MS with protein database searching of in-gel digests for each of the 9 spots with 4.0 to 38% sequence coverage and at least two peptides per protein.
