
Figure 2.
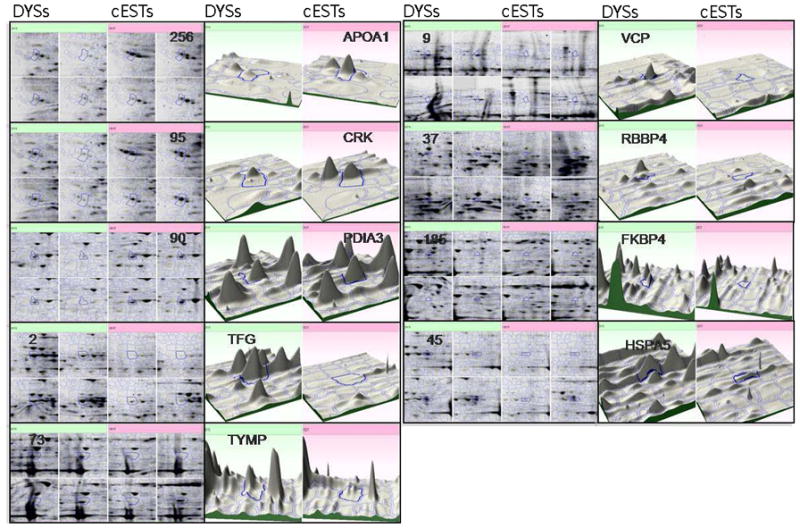
Expanded views of 2-DE gel images for individual cGCT specimens (4 DYSs and 4 cESTs), labeled by their gene symbols and protein spot numbers as shown in Table 1, are shown for proteins that are up-regulated in DYSs vs. cESTs (green, left quadrants) and CESTs vs. DYSs (pink, right quadrants). Three-dimensional plots illustrate the fold-change observed in representative pairs of specimens.