
Figure. 2.
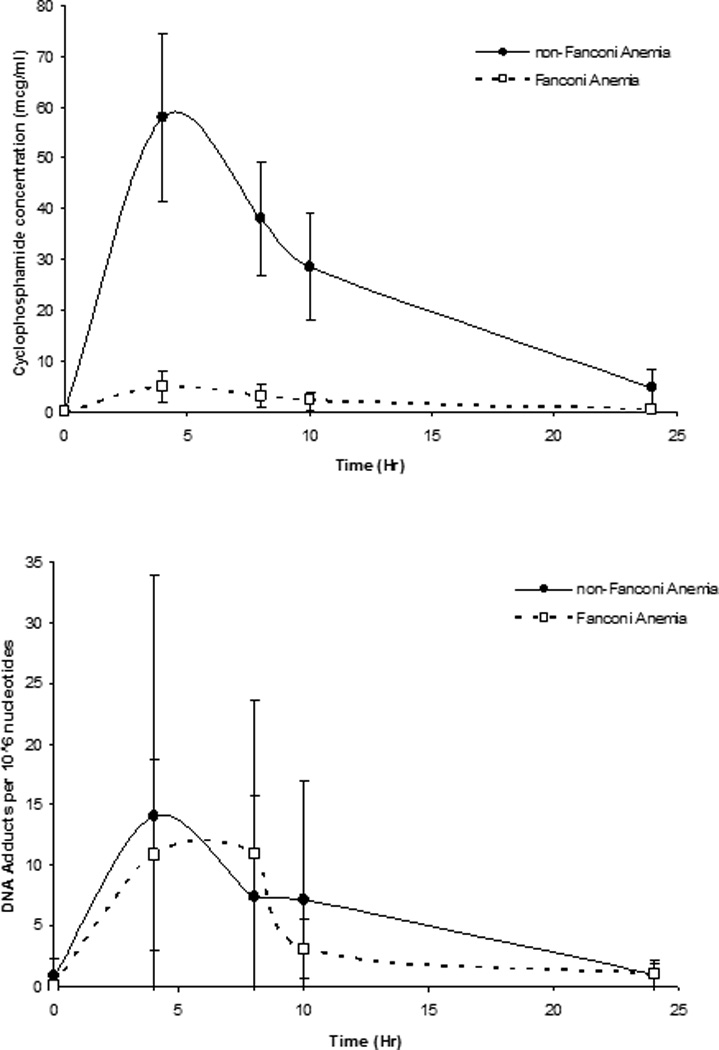
Time concentration profiles for cyclophosphamide (top panel) and G-NOR-G DNA adducts per 106 nucleotides (bottom panel). FA profiles are denoted with open squares (□) and non-FA profiles are denoted with closed circles (●). Times are hours after the end of a 2 hour infusion. Zero hour designates the time immediately before the start of infusion. Data are mean ± S.D.