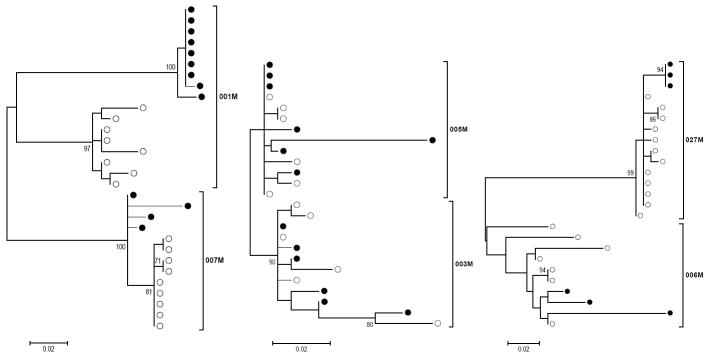
Figure 1. Maximum Likelihood Model Phylogenetic Analysis shows compartmentalization in patients with higher CD4+ T cell counts.
Maximum likelihood model was employed to infer evolutionary history. Trees indicate phylogenetic relationship of clones isolated from vaginal fluid (closed circles) or plasma (open circles) from simultaneous samples. Patients 001M and 007M trees indicate separation of clones from plasma and vaginal fluid (leftmost tree). The phylogenetic arrangements of clones from 005M, 003M (middle tree) and 027M, 006M (rightmost tree) fail to show separate clusters of plasma and vaginal fluid clones. Scale bars indicate 2 nucleotide changes per 1000 positions. Bootstrap values greater than 70 are shown to indicate strength of clustering patterns.

