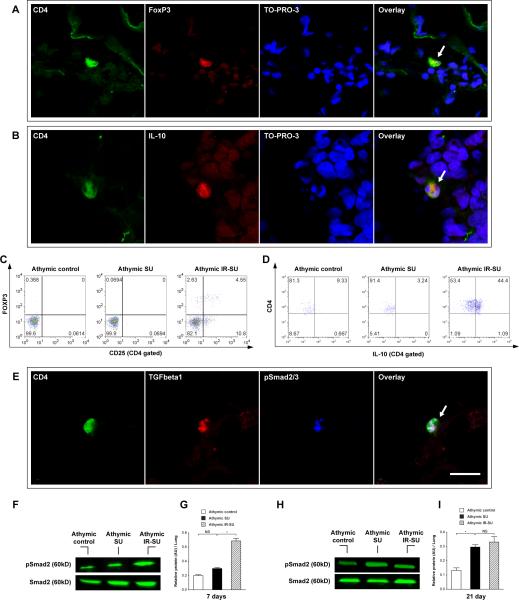
Figure 4.
Seven days after SU5416 administration, IR results in migration of TGFβ+ and IL-10+ expressing T cells into the lungs. (A) Immunofluorescent images of lung sections for Tregs cells (CD4+FoxP3+) (arrow) in athymic IR-SU group at d7 (n=7/group). (B) Immunofluorescent images of lung sections for CD4+IL-10+cells (arrow) in athymic IR-SU group at d7 (n=7/group). (C,D) Flow cytometry data of peripheral blood for FoxP3+and IL-10+ detection on d7 in athymic IR-SU group. (E) Immunofluorescent images of lung sections for CD4+TGFβ+ pSmad2/3+ cells (arrow) in athymic IR-SU group at d7 (n=7/group). (F,G,H,I) Western blot analysis from whole lung lysate and protein levels of pSmad2 and Smad2 on d7 and d21(n=8/group). Data are shown as means with error bars representing SEM. * p<0.05. Scale bar = 6.25 μm.

