Figure 7.
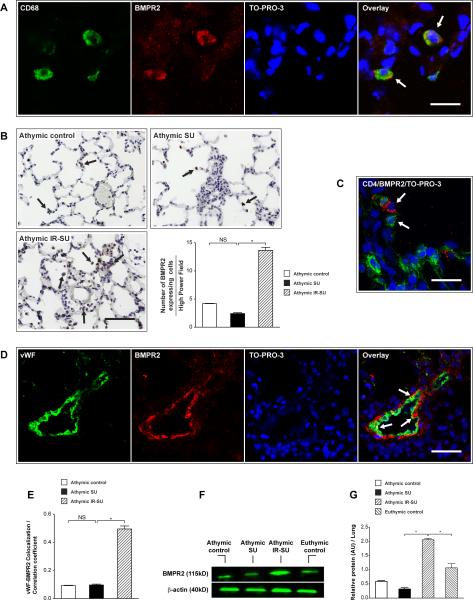
IR of athymic rats leads to increased BMPR2 expression in the lung. (A) Immunofluorescent images show colocalization of BMPR2 expressing cells and CD68 in all three animal groups. (B) Immunohistochemistry and quantitation of BMPR2 expressing cells in lungs sections of athymic control, athymic SU and athymic IR-SU rats. (C) Immunofluorescent image of lung tissue shows BMPR2 expressing cells (red) are adjacent to CD4+ cells (green) in athymic IR-SU group. (D) Immunofluorescent images of lung section shows that vWF colocalizes with BMPR2 (arrow) in vascular endothelial cells at d21 in athymic IR-SU rats (n=4/group). (E) The vWF-BMPR2 colocalization coefficient at d21. (F,G) Western blot analysis of BMPR2 protein levels at d21 from whole lung lysates (n=8/group). Data are shown as means with error bars representing SEM. * p<0.05. Scale bar: (A,C)=25 μm; (B,D)=50 μm.

