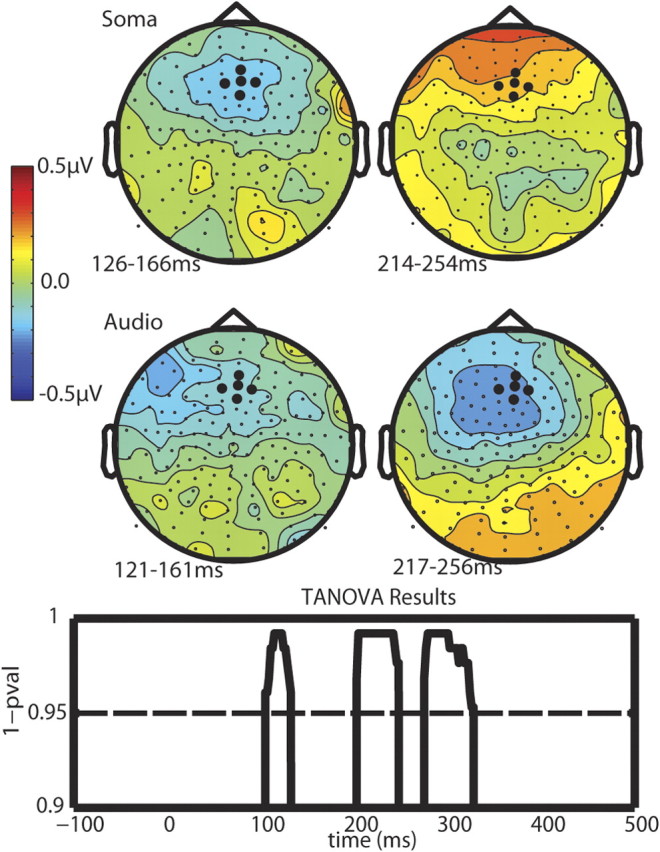
Figure 2.

Topographical plots of the grand average mismatch waves for each modality (row) and each phase (column). The MMN is plotted at peak latency for each modality at the two different phases. The TANOVA tested for topographical differences at each time point between the sMMN and the aMMN.
