
Figure 1.
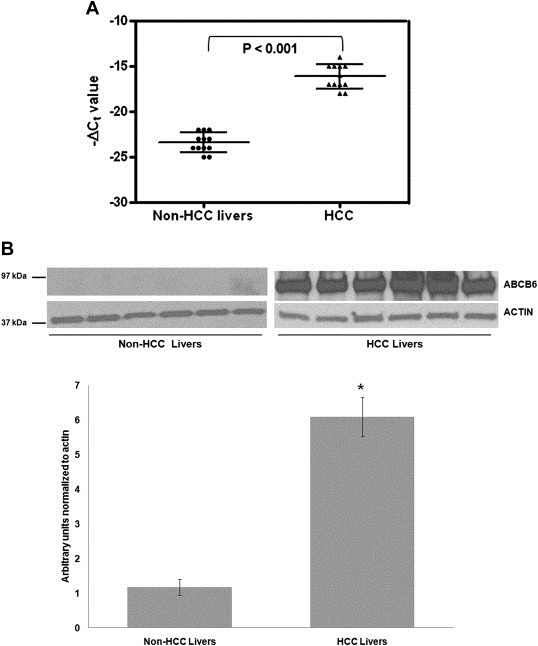
ABCB6 expression is upregulated in HCC. (A) Transcript level of ABCB6 was measured in 12 paired HCC specimens and corresponding adjacent non‐cancerous livers by quantitative RT‐PCR, where β‐actin was used as internal reference control. Each scatter plot displays the expression level of a given HCC specimen or adjacent liver (non‐HCC livers), where the lines represent the median with interquartile range of −ΔCt value; P value was calculated by Student's t test. (B) Top panel: relative levels of ABCB6 protein in six HCC specimens and six non‐HCC liver. Each protein band represents an individual patient sample. ABCB6 expression was measured in total lysate using ABCB6 specific antibody. Bottom panel: image J analysis of average ABCB6 protein expression in HCC and non‐HCC livers normalized to internal reference control β‐actin. ‘*’ Significantly different from non‐HCC livers: p < 0.05.