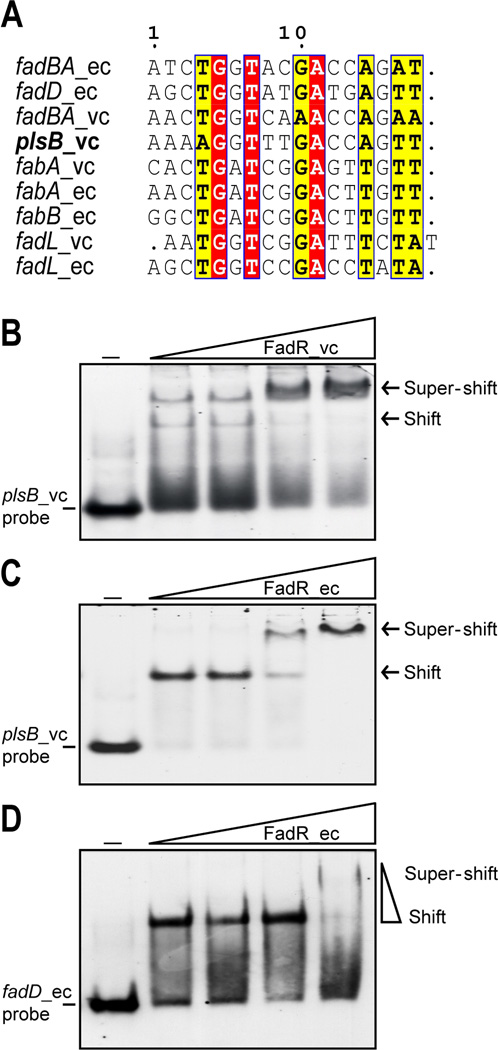
Fig. 5. The V. cholerae plsB promoter region binds both V. cholerae FadR and E. coli FadR.
A. Sequence alignments of the putative plsB FadR-binding site with known sites. Identical residues are black letters with red background, similar residues are in black letters in yellow background and differing residues are in grey letters.
B & C. Electrophoretic mobility shift assays of the binding of V. cholera FadR (B) or E. coli FadR (C) to the V. cholera plsB promoter region.
D. Binding of E. coli FadD promoter region to FadR protein.
The minus sign denotes no addition of FabR protein whereas the DIG-labeled probe shifted by FadR protein is indicated with an arrow. The FadR levels in the right hand four lanes of each panel were (from left to right) 5, 10, 20 and 50 pmol. The protein samples were incubated with 1 pmol of DIG-labeled probe in a total volume of 20 µl. Designations ec and vc denote E. coli and V. cholerae, respectively. FadR_ec and FadR_vc denote the FadRs of E. coli and V. cholerae, respectively. Representative gels (8% native PAGE) from at least three independent gel shift assays are given.

