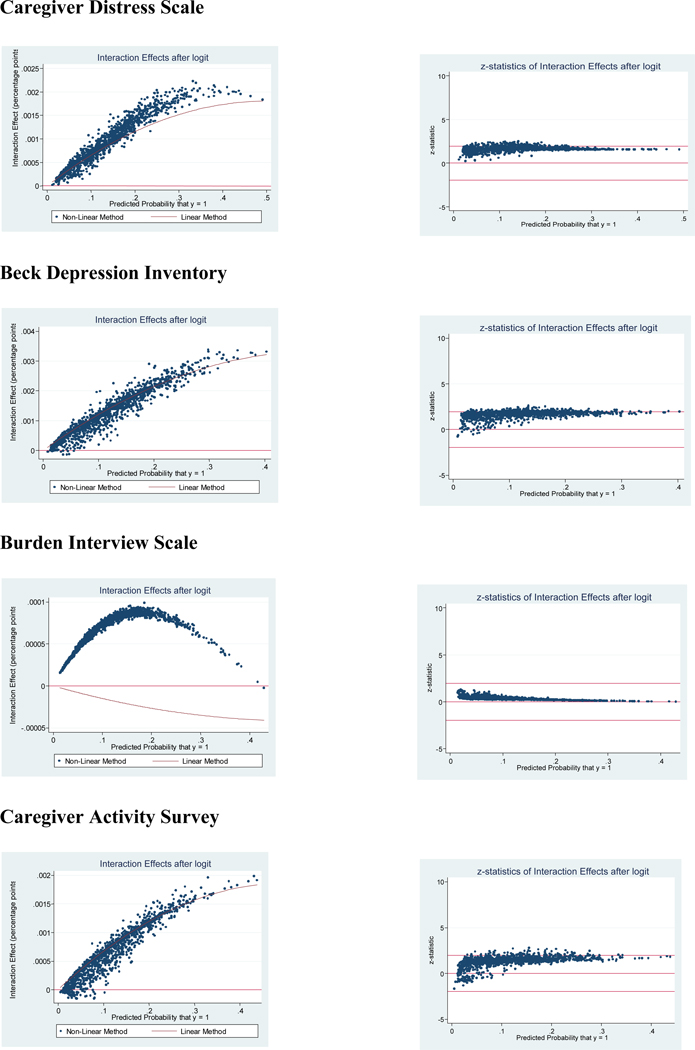
Figure 2. Interaction Effects and Z-Statistics with 95% CIs across All Observations*.
* Derived using the INTEFF command in Stata 11.0 based on logistic regressions without random effects. Two graphs are reported for each of the four HUI-III*caregiver burden interaction models generated. Both plot the predicted probabilities for each observation on the x axis. The first compares the interaction effects calculated using the non-linear method (scatter plot) to those calculated using the linear method (line). The second plots the z-statistics calculated for each observation along with the 95% confidence interval. Those z-statistics falling between −1.96 and +1.96 (the outer two lines) are statistically significant the .05 level.

