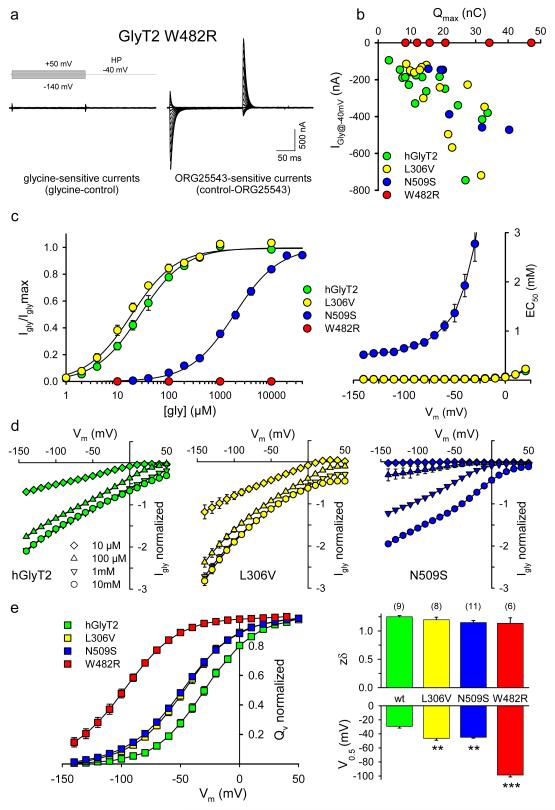
Fig. 4. Electrophysiological characterization of hGlyT2 mutants.
a, Steady-state (Igly) and transient currents of W482R are insensitive to glycine (10 mM, left) while ORG25543 (5 μM) blocked Na+-dependent transient currents (right). HP: holding potential. b, Plot of Igly (-40 mV) and ORG25543-sensitive charge movement relationship for hGlyT2 and mutants. Igly are evoked with applications of [Gly] = 1 mM (hGlyT2, L306V) or [Gly] = 10 mM glycine (N509S, W482R). Qmax are obtained as described below. c, Left: glycine dose-response curves of Igly for hGlyT2 and mutants. EC50 values were 26.9 ± 3.3 μM (hGlyT2), 18.8 ± 1.5 μM (L306V) and 1923.8 ± 227.7 μM (N509S) at −40mV; 22.5 ± 3.15 μM (hGlyT2), 15.9 ± 1.2 μM (L306V) and 913.1 ± 72.16 μM (N509S) at −70mV. Curves are fitted with the equation Igly = Iglymax/(1 + EC50/[gly]) and normalized to Iglymax (n = 3-5). Right: Plot of glycine EC50-Vm relationship for hGlyT2 and mutants. d, Normalized Igly-Vm curves for hGlyT2 and mutants. Igly were normalized to the glycine (10 mM)-evoked currents recorded at −40 mV (n = 3-7). e, left: Normalized QVm −Vm relationships for hGlyT2 and mutants. QVm are the time-integrals of ORG25543-sensitive transient currents. QVm −Vm curves are fitted to the Boltzmann equation: QVm = Qmin + Qmax/[1 + exp (0.03 zδ (V0.5-Vm))] and normalized to Qmax. Right: Histograms of the mean zδ (top) and V0.5 (bottom) for hGlyT2 and mutants. zδ values were 1.25 ± 0.02 (hGlyT2), 1.20 ± 0.05 (L306V), 1.15 ± 0.04 (N509S) and 1.14 ± 0.1 (W482R); V0.5 values were −29.3 ± 2.44 (hGlyT2), −46.4 ± 2.7 (L306V), −44.8 ± 1.25 (N509S) and −9 8.6 ± 2.75 (W482R). Statistical comparisons were made using a paired F-Test, ** indicates p<0.01; *** p<0.001, means ± s.e.m., with n = number of oocytes).

