
Figure 8. Experimental recordings showing changes in blood flow ( ) or perfusion pressure (Ppa), Pdu Pca and
  to sympathetic nerve stimulation in glands with spontaneous blood flow (A) and glands with constant-flow vascular perfusion (B).
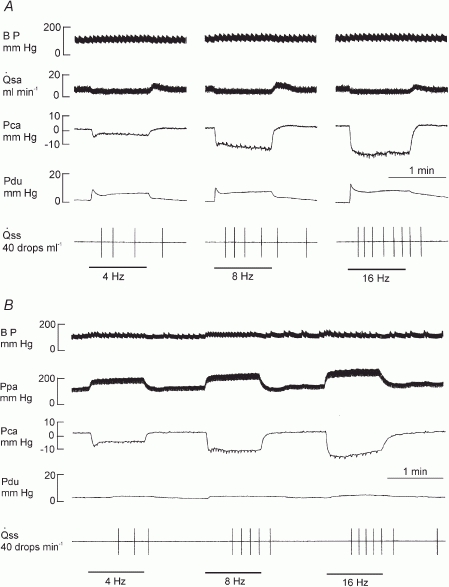
Bar, stimulation.