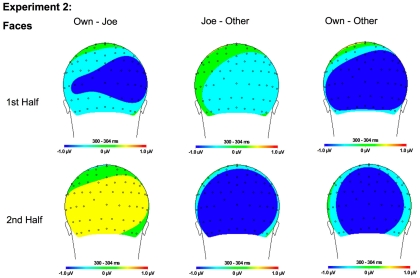
Figure 10.
Topographical maps for Experiment 2 faces showing the difference in amplitude between Own and Joe, Joe and Other, and Own and Other conditions during the first and second half of the experiment. Time points were selected as the average latency where differences across conditions were maximal.

