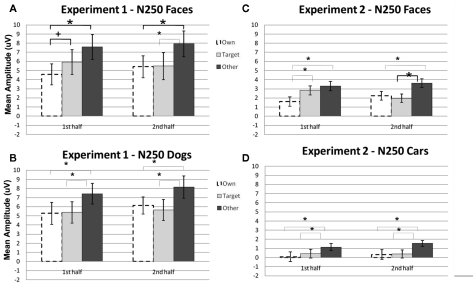
Figure 3.
Comparison of mean amplitude of the N250 to Own, Target, and Other conditions across the first and second experimental halves for (A) Experiment 1 faces, (B) Experiment 1 dogs, (C) Experiment 2 faces, and (D) Experiment 2 cars. Error bars represent 95% confidence intervals. Experiment 1 electrode sites: average P07, P08; Experiment 2 electrode sites: Mean of electrodes in the left hemisphere (58, 59, 64, 65, and 70) and right (92, 97, 91, 96, 90, and 95) hemispheres, corresponding to regions between standard locations and O1/O2 and T5/T6. *p < 0.05, +p = 0.07.

