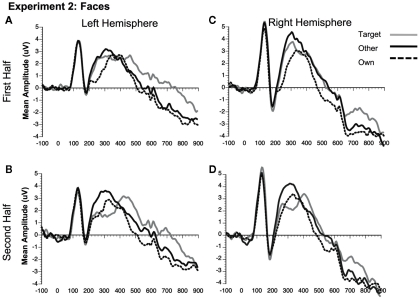
Figure 8.
Comparison of ERP waveforms from stimulus onset to Own, Target, and Other conditions for Experiment 2 faces (A) first half left hemisphere, (B) second half left hemisphere, (C) first half right hemisphere, and (D) second half right hemisphere. Left hemisphere electrodes: average 58, 59, 64, 65, 69, and 70; Right hemisphere electrodes: average 92, 97, 91, 96, 90, and 95.

