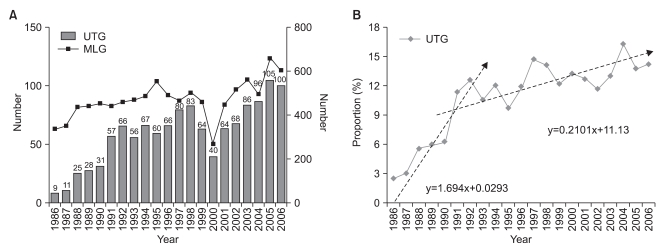
Fig. 1.
Chronological changes in gastric cancer patient numbers based on tumor location. (A) Annual number of UTG and MLG at SNUH. UTG was 2.6% (9 patients) in 1986 and rapidly increased to 12.5% (66 patients) in 1992. It reached a peak of 16.2% (96 patients) in 2004. A temporary drop in the rate to 12.5% (40 patients) was observed in 2000, which may be related to a medical strike at the time in Korea for separating medical practice and pharmaceutical dispensing system. (B) Estimated increase in the rates of UTG by linear regression analysis. Before 1992, UTG had been increasing at the rate of 1.69% per year (P<0.001, R2=0.913); since 1992, the rate has reduced at 0.21% per year (P=0.028, R2=0.321). UTG = upper third gastric cancer; MLG = middle or lower third gastric cancer; SNUH = Seoul National University Hospital.

