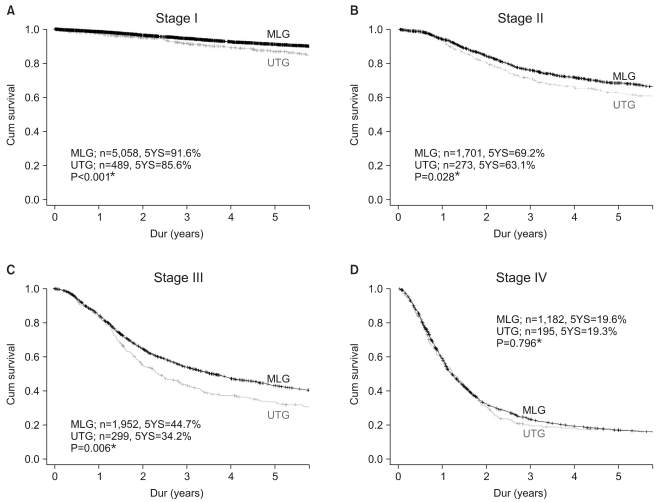
Fig. 3.
Survival curve of gastric cancer in each stage based on the tumor locaton. Five-year survival rates in UTG were significantly lower compared with MLG in stage I, II, and III; there was no significant difference in stage IV. (A) Stage I. (B) Stage II. (C) Stage III. (D) Stage IV. MLG = middle or lower third gastric cancer; UTG = upper third gastric cancer; YS = year survival rate. ‡P<0.05, statistically significant.

