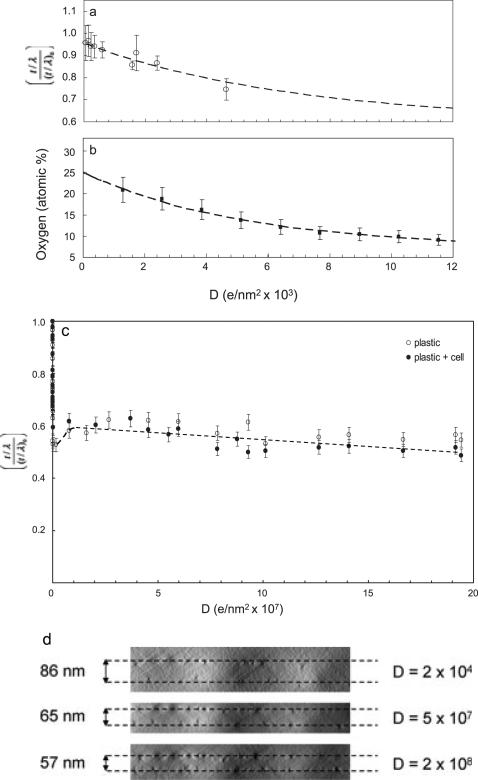
Fig. 3.
Mass and oxygen loss measured in regions of Epon plastic and cellular material as a function of electron dose. The relative thickness t/λ measurementin (a) shows that the initial stage of the beam damage follows an exponential decay (dashed line) at electron doses <104 e–/nm2. To avoid the spread in y values due to the disparities in initial specimen thickness (t/λ)0, the measured t/λ values are divided by (t/λ)0, thus normalizing the maximum specimen thickness to unity. The damage dose obtained by fitting the exponential decay is 6.8 × 10³ e–/nm2, at which the mass loss has reached about 30%. We associate this mass loss with the loss of oxygen atoms from the embedding material, as shown in (b). The atomic percentage of oxygen was calculated from energy loss spectra obtained at different doses, and obtained from fitting an exponential decay curve was 5.4 × 10³ e–/nm2. At doses above 104 e–/nm2 at least two-thirds of the oxygen has been lost from the specimen. The relative thickness measurement in (c) extends the mass loss measurements up to electron doses of 2 × 10⁸ e–/nm2. Two phenomena are evident: rapid mass loss at doses <105 e–/nm2, which is also shown in (a), and a much slower decay at doses >107 e–/nm2, which appears to follow a simple linear function. A small increase in t/λ at intermediate doses is attributed to lateral shrinkage of the specimen Even for very high doses of 108 e–/nm2 the total mass loss does not exceed approximately 50%. Locations of gold fiducial nanoparticles in y-z tomographic projections in (d) allow measurement of absolute changes in thickness (indicated in nm) as well as the lateral shrinkage.

