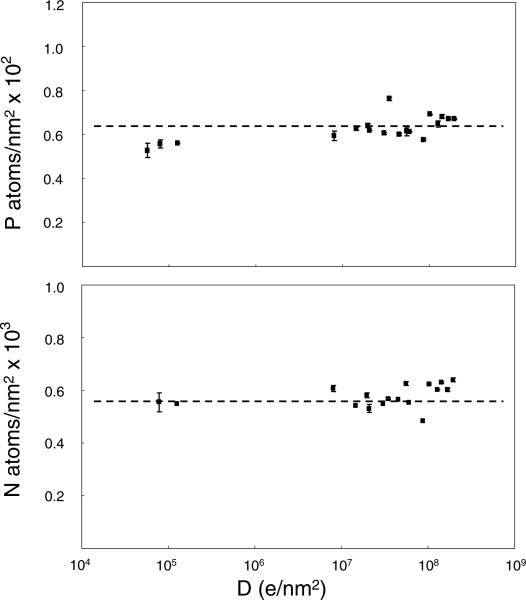
Fig. 4.
Measurement of phosphorus and nitrogen distributions (atoms/nm2) in thymocyte nucleus as function of electron dose. Each data point was calculated from a series of four images with intensities Iunfilt (unfiltered), Izero (zero-loss), Ipre (pre-edge), and Ipost (post-edge), for P and N, respectively. Even for doses exceeding 107 e–/nm2, which are typically required for elemental tomography, no significant loss of P and N was observed. It was not feasible to obtain useful compositional maps below a dose of 105 e–/nm2 because the signal-to-noise ratio was too low.

