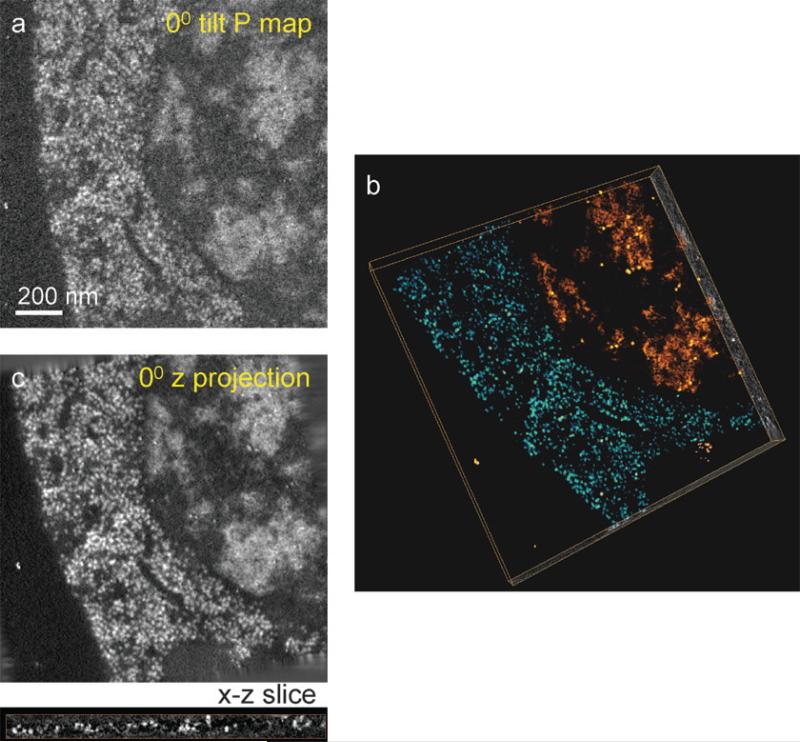
Fig. 6.
Demonstration of 3D quantitative elemental tomography used to map the distribution of phosphorus in 80-nm-thick plastic section of a C. elegans cell. Net phosphorus distributions were calculated from four tilt series of unfiltered bright field, Iunfilt, zero-loss, Izero, P pre-edge, , and P post-edge, . (a) The net 2D phosphorus distribution at 0° tilt. (b) Volume rendered reconstructed tomogram obtained using the SIRT algorithm, reveals two regions of high phosphorus content: cytoplasm containing ribosomes (blue/green) and nucleus containing areas of densely packed chromatin (orange/red). (c) Projected phosphorus distribution along the z-direction at 0° tilt obtained from the tomogram in (b) shows improved signal-to-noise ratio relative to (a) due to the principle of dose fractionation. An x-z slice extracted from (b) shows the roundness and clarity of ribosomes. The dose used to acquire all the data was 8 × 10⁷ e–/nm2, which did not cause further observable damage to the specimen after initial shrinkage and mass loss.

