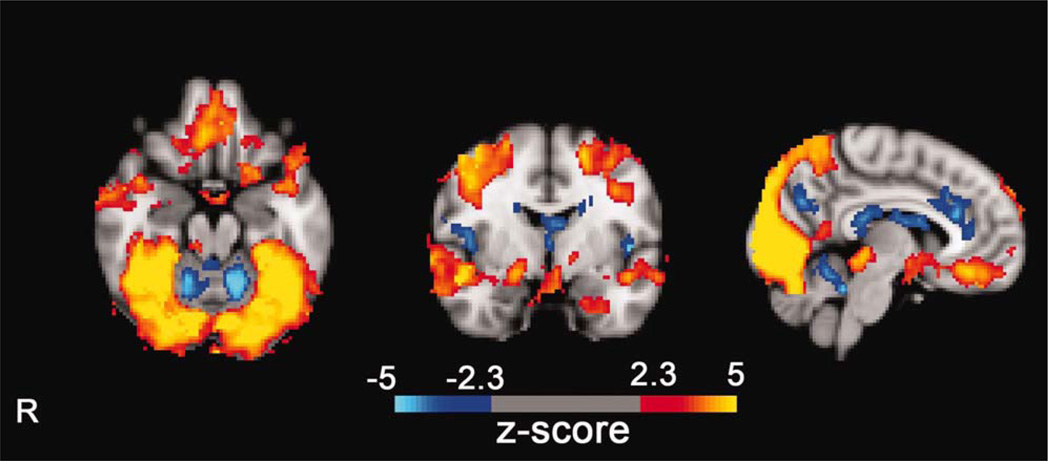
Figure 1.
Clusters discovered using ICA showing common components found in smokers who performed visual cue-induced craving, crave resist, and neutral control tasks while undergoing fMRI scanning. The maps represent in color the relative weighting of each of 110 brain regions expressed in the components. The amplitude values are expressed in normalized units. Areas of the brain containing principally myelinated axonal fibers (as opposed to neuronal cell bodies) are not shown in color and were not entered into the analyses. [Color figure can be viewed in the online issue, which is available at wileyonlinelibrary.com.]

