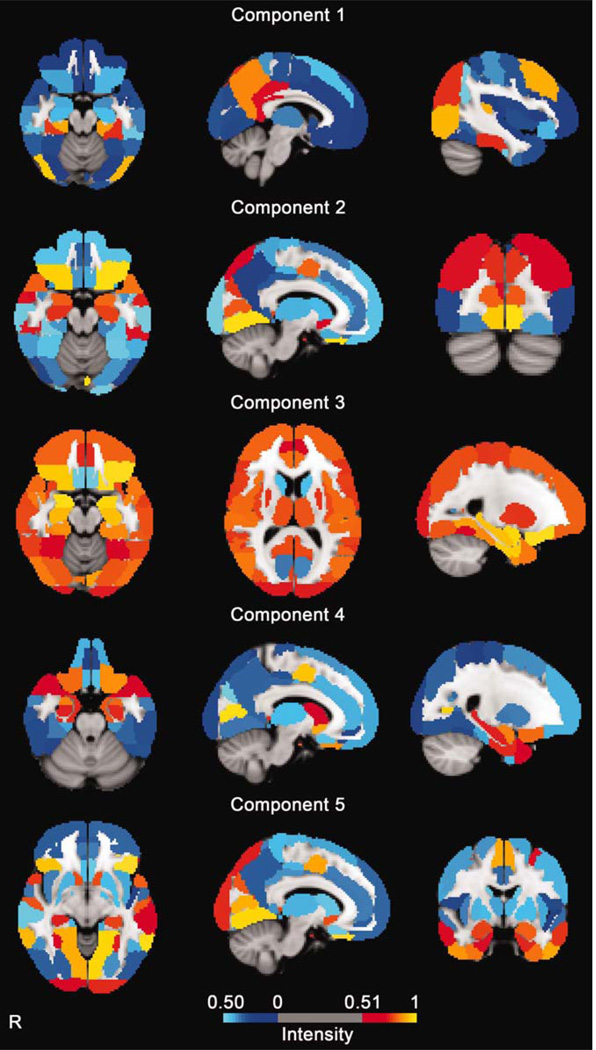
Figure 2.
Results using the standard univariate generalized linear modeling method to find areas of the brain active in smokers undergoing an fMRI scan. The results show the signal difference between a visual cue-induced craving task and a resting baseline. By convention, the color scale indicates z scores derived from t-statistics in the task contrast. [Color figure can be viewed in the online issue, which is available at wileyonlinelibrary.com.]

