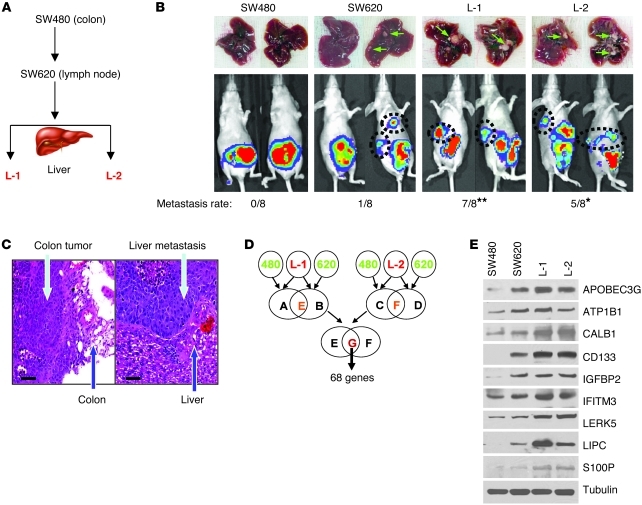
Figure 1. Identifying a gene expression signature for colorectal cancer liver metastasis.
(A) Flow chart of in vivo selection process of colorectal cancer cell metastasis to the liver. The nonmetastatic colorectal cancer cells (SW480) and those with only lymph node metastasis (SW620) were inoculated into the colon of nude mice. Liver tumors were detected by the IVIS Imaging System (Caliper Life Sciences), and tumor cells (L-1 and L-2) were then isolated from the liver lesions and reinoculated to confirm their metastatic phenotype. (B) Representative images of the liver metastases (upper panels) and IVIS luciferase images in mice inoculated with colorectal cancer cells (lower panels). The hepatic metastasis rate of colorectal cancer cells is indicated at the bottom. *P < 0.05; **P < 0.01 compared with SW480 and SW620 cells. (C) Representative immunohistochemistry staining of colorectal primary tumor and hepatic metastases from the orthotopic transplanted nude mice. Scale bars: 50 μm. (D) Gene expression profiles reveal a set of 68 genes that are highly expressed in L-1 and L-2 cells as compared with SW480 and SW620 cells. (E) Immunoblotting analysis of gene expression levels in SW480, SW620, L-1, and L-2 cells.

