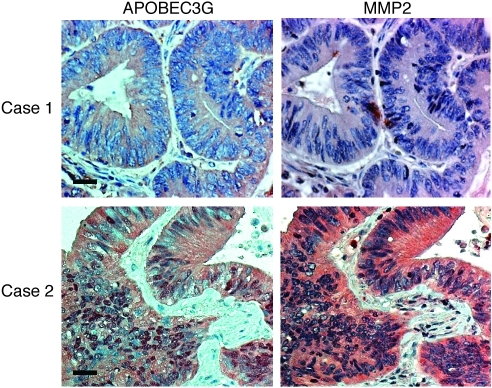
Figure 6. APOBEC3G expression is correlated with MMP2 expression and tumor stage in primary colorectal cancer samples.
Representative staining of APOBEC3G and MMP2 in colorectal cancer samples. Case 1 is a representative specimen with a low level or no expression of APOBEC3G and MMP2; case 2 is a representative specimen with a high level of APOBEC3G and MMP2. Scale bar: 50 μm.

