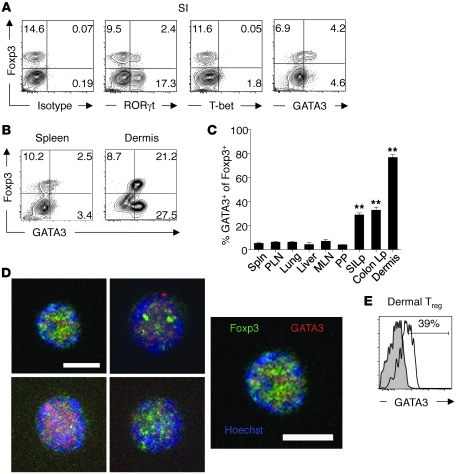
Figure 1. Dermis and gut Lp Tregs express high levels of GATA3.
(A) Gut Tregs express RORγt and GATA3. Cells were harvested from SILp, stained for T-bet, RORγt, GATA3, and Foxp3, and assessed by flow cytometry. Plots are gated on live CD4+TCR-β+ cells; isotype for RORγt. (B) GATA3 is highly expressed in dermis Tregs. Cells were harvested from spleen and ear pinna, stained for GATA3 and Foxp3, and assessed by flow cytometry. Plots are gated on live CD4+TCR-β+ cells. Numbers in quadrants refer to the percentage of each subset. (C) Barrier tissue resident Tregs express higher levels of GATA3 than peripheral Tregs. Percentages of Foxp3+CD4+TCRβ+ cells expressing GATA3 in spleen (Spln), peripheral LN (PLN), lung, liver, mesenteric LN (MLN), Peyer patches (PP), SILp, colon Lp, and dermis. **P < 0.001. n = 3 mice per group. Data are presented as mean ± SEM. (D) Nuclear localization of GATA3. Foxp3eGFP+ cells were purified by sorting from the SILp of naive Foxp3eGFP mice and stained for Foxp3 (green), GATA3 (red), and Hoescht (blue), and localization of proteins was assessed by confocal microscopy. Right image is enlargement of top left image. Scale bars: 5 μm. (E) GATA3 is expressed by dermis Tregs in rhesus macaque. Cells were harvested from the dermis and stained for CD3, GATA3, and Foxp3. Number refers to frequency of GATA3+ cells. Plot is gated on live Foxp3+CD3+CD8– cells (filled histogram, isotype control; open histogram, GATA3). Data shown are representative of 3 independent experiments (A and B) and 1 experiment (E) with similar results.

