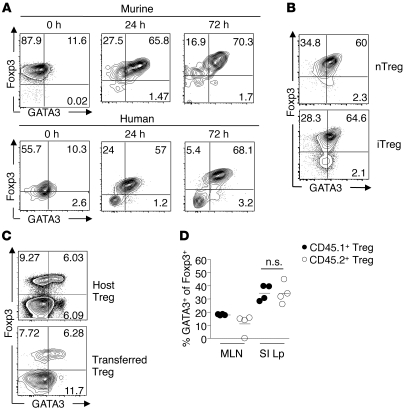
Figure 2. TCR activation triggers GATA3 expression in mouse and human Tregs.
(A) Expression of GATA3 by nTregs. Murine: sort-purified CD4+eGFP+ cells from peripheral LNs of Foxp3eGFP mice were cultured as described in methods. Human: sort-purified CD4+CD25+CD127lo cells from peripheral blood were cultured as described in Methods. Cells were stained for Foxp3 and GATA3 and analyzed by flow cytometry. Numbers in quadrants refer to the percentage of each subset. Plots are gated on live CD4+ cells. (B) Expression of GATA3 by in vitro iTregs. Sort-purified CD4+eGFP+ cells cultured in the presence of 1 ng/ml rIL-2 and anti-CD3 antibody (nTreg, top panel) and sort-purified CD4+eGFP– cells incubated with rIL-2 and TGF-β (iTreg, bottom panel). Numbers in quadrants refer to the percentage of each subset. Plots are gated on live CD4+ T cells. (C) Expression of GATA3 by in vivo iTregs. OT-II-Foxp3eGFP– cells were transferred into CD45.1+ hosts and fed ovalbumin in their drinking water for 7 days. Cells were harvested from the MLN and SILp, stained for Foxp3 and GATA3, and analyzed by flow cytometry. Plots are gated on live CD4+TCRβ+ cells from the SILp. Numbers in quadrants refer to the percentage of each subset. (D) Graphical representation of FACS plots in C (CD45.1+ host cells, closed circles; CD45.2+OT-II transferred cells). Each circle represents 1 mouse, and crossbars depict the mean of 3 mice analyzed. Data shown are representative of at least 3 independent experiments with similar results.

