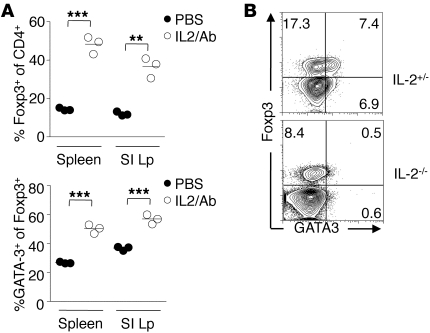
Figure 3. GATA3 expression by Tregs is positively regulated by IL-2.
(A) Induction of GATA3 expression by IL-2/anti–IL-2 treatment. Naive C57BL/6 mice were treated with rIL-2/anti–IL-2 complexes for 6 days. Cells were harvested, and their expression of GATA3 was evaluated by flow cytometry. Each circle represents 1 mouse, and crossbars depict the mean of 3 mice analyzed. Graph represents the percentage of live Foxp3+CD4+TCRβ+ expressing GATA3 in the spleen and SILp. **P ≤ 0.0014; ***P < 0.0007. (B) IL-2–deficient mice express reduced levels of GATA3 in SILp Tregs. Cells were isolated from the SILp of 8-week-old Il2+/– control mice or IL-2–deficient mice (Il2–/–) and stained for Foxp3 and GATA3. Plots are gated on live CD4+TCRβ+. Numbers in quadrants refer to the percentage of each subset. Data shown are representative of at least 2 independent experiments with similar results.

