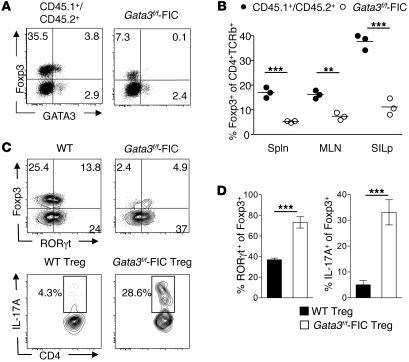
Figure 5. GATA3-deficient Tregs do not accumulate in inflamed tissues.
(A–D) GATA3-deficient Tregs do not compete with WT Tregs. Ten weeks after reconstitution, cells were harvested from the SILp and stained for congenic markers CD45.1, CD45.2, CD4, CD25, Foxp3, and TCR-β. FACS plots are gated on live CD4+TCR-β+ cells and appropriate congenic markers. Numbers in quadrants refer to the percentage of each subset. (B) Graphical representation of percentage of Foxp3+CD4+TCR-β+ cells in the spleen, mesenteric lymph node, and SILp. Each circle represents 1 mouse, and crossbars depict the mean of 3 mice analyzed. *P < 0.05; **P < 0.01; ***P < 0.001 compared with CD45.1+/CD45.2+ Tregs. (C) GATA3-deficient Tregs express high levels of RORγt and IL-17A. Cells were harvested from the SILp as in A and then stained for congenic markers, CD4, TCR-β, Foxp3, GATA3, and RORγt (top panels) or stimulated for 3 hours with PMA/ionomycin and brefeldin A and then stained for congenic markers, CD4, TCR-β, Foxp3, and IL-17A (bottom panels). Plots are gated on congenic markers CD4+TCR-β+ (top panels) and Foxp3+ (bottom panels). Numbers in quadrants refer to the percentage of each subset. (D) Graphical representation of data in above FACS plots. n = 3 mice per group. ***P ≤ 0.0004. Data shown are representative of 3 independent experiments with similar results. Data are presented as mean ± SEM.

