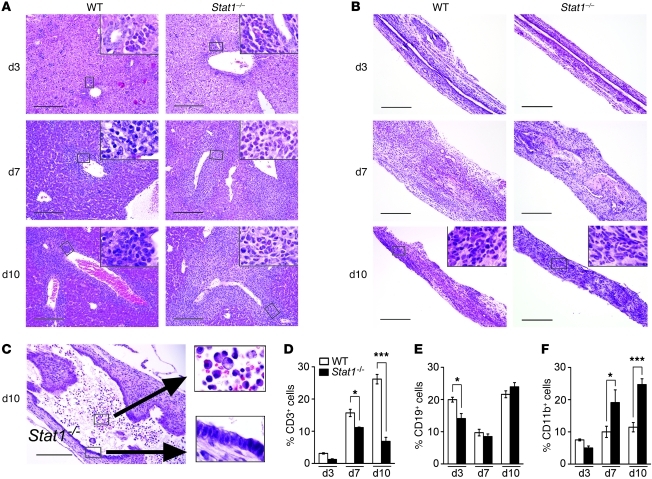
Figure 5. Myeloid cells infiltrate livers and bile ducts of Stat1–/– mice after RRV challenge.
H&E staining of liver sections shows mild infiltration of portal tracts by neutrophils 3 days after RRV in WT and Stat1–/– mice (A). The degree of infiltration increases in both mouse lines at 7 and 10 days, primarily with lymphocytes in WT mice and persistent neutrophilic infiltration in Stat1–/– mice. (B) Similar staining of longitudinal sections of extrahepatic bile ducts shows mild submucosal inflammation at day 3, formation of an inflammatory plug obstructing the lumen at day 7, and the ongoing obstruction at day 10. Notably, inflammatory cells in WT bile ducts are predominantly lymphocytes at day 10, while they are primarily neutrophils in Stat1–/– ducts. (C) Section in the distal end of a Stat1–/– duct shows a cystic dilatation, which is lined by largely intact epithelium but also displays neutrophils and macrophages in the lumen and within the wall. Scale bars: 200 μm; original magnification, ×1000 (insets). (D–F) Mean ± SEM percentage of hepatic mononuclear cells that are stained for CD3, CD19, and CD11b by flow cytometry at days 3, 7, 10 after RRV challenge. *P < 0.05; ***P < 0.001. n = 4–10 mice in each group.

