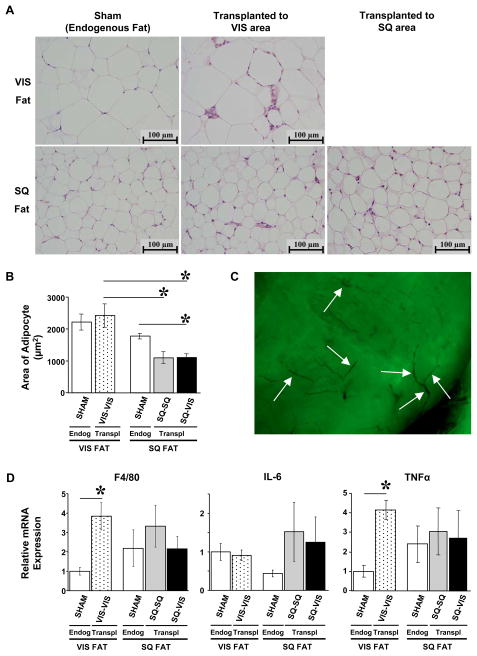
Figure 5.
Histology and Inflammatory Markers in Transplanted and Endogenous Fat in Cohort 2. (A) H&E staining of VIS and SQ fat pads were performed in all groups of cohort 2. Transplanted VIS and SQ fat pads had normal histology in comparison to endogenous VIS and SQ fat pads in the sham group as shown at 400X magnification. (B) Area of adipocytes was measured on the H&E slides with ImageJ software. Transplanting SQ fat to the visceral cavity (SQ-VIS group) significantly decreased the mean area of the adipocytes in comparison to that of the endogenous SQ fat in the sham group. (C) Whole-mount of transplanted fat graft expressing GFP was viewed under UV light. Arrows indicate sites of vascularization in the fat graft. (D) Presence of macrophages and inflammatory markers was assessed by quantifying mRNA expression levels of macrophage cell surface receptors F4/80 and inflammatory cytokines interleukin-6 and TNF-α by real-time qRT-PCR. Levels in the VIS-VIS fat grafts were significantly higher than that of the endogenous VIS fat in the sham group. There were no significant differences in macrophages, IL-6, or TNF-α among the SQ-SQ and SQ-VIS fat grafts and the endogenous fat pads.

