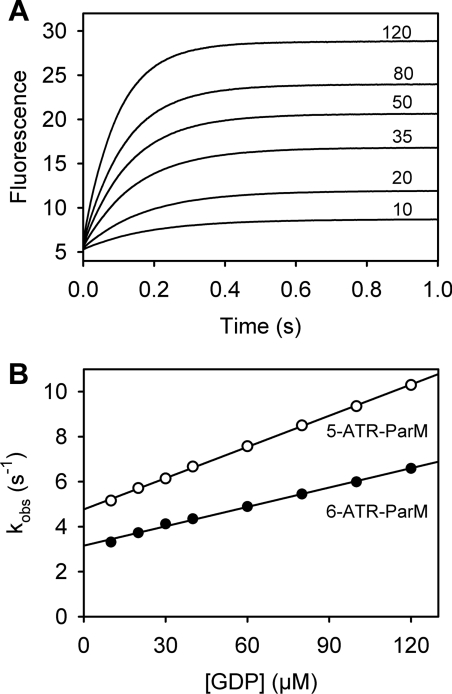
Figure 2. Kinetics of GDP binding to the biosensor.
(A) Fluorescence time courses after mixing 0.1 μM 5-ATR–ParM with increasing concentrations of GDP in a stopped-flow apparatus. Micromolar GDP concentrations are indicated in the Figure. All concentrations are those in the mixing chamber. Fluorescence was excited at 546 nm and emission was detected after a 570 nm long-pass filter. Data were analysed by single exponential curve fitting yielding the observed rate constant kobs. (B) Plot of kobs against GDP concentration for 5-ATR– (open circles) and 6-ATR– (closed circles) ParM. Association (kon) and dissociation (koff) rate constants were obtained from linear regression analysis. For 5-ATR–ParM, kon is 0.047 μM−1·s−1 and koff is 4.8 s−1; for 6-ATR–ParM, kon is 0.029 μM−1·s−1 and koff is 3.2 s−1. Experiments were performed in 30 mM Tris/HCl (pH 7.5), 25 mM KCl, 3 mM MgCl2 and 5 μM BSA at 20°C.

