Figure 3.
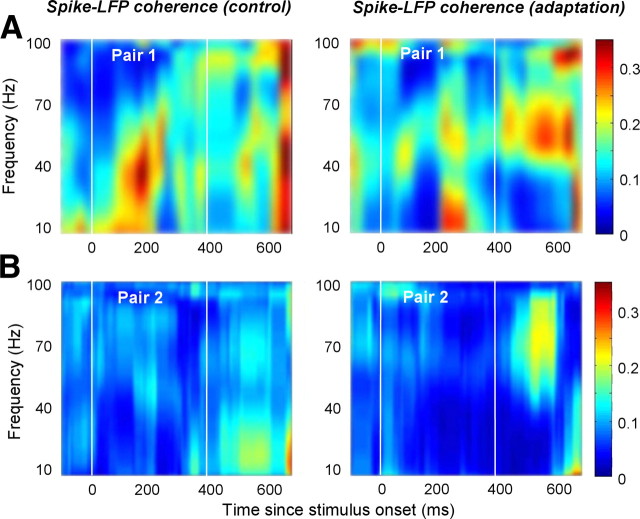
Examples of spike–LFP coherence as a function of time. A, B, Spike-field coherence from two pairs of recording sites during control (left) and adaptation (right). The x-axis represents time relative to the onset of the test stimulus. The two vertical lines mark the times when the adapting and test stimuli are presented.

