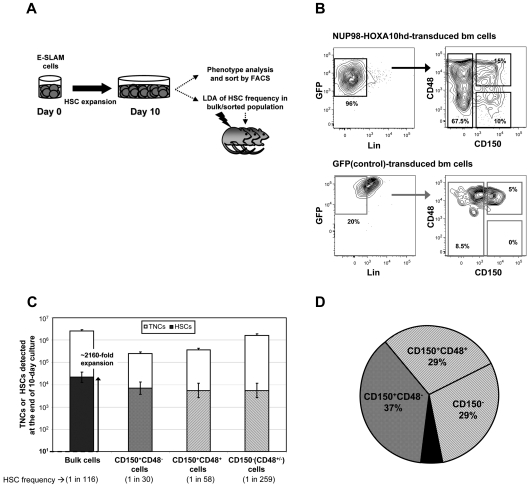
Figure 3.
CD150+CD48− subset of day 10 NUP98-HOXA10hd–transduced and expanded population contains less than half of the total HSCs generated in vitro. (A) Schematic of the experimental design where after 10-day NUP98-HOXA10hd–induced HSC expansion in vitro, bulk or purified cells were isolated based on the phenotype indicated in panel B or Figure 4A and assayed for HSC content by LDA. Because cultures were depleted of HSCs by day 10, cultures containing GFP-transduced control cells were only used for immunophenotyping and comparison and not for further transplantation assays. (B) Representative profiles of viable, Lin− NUP98-HOXA10hd–, and GFP-transduced day 10 cells, assessed for CD150 and CD48 expression. (C) Empty bars indicate the average number (expressed as the means ± SD) of bulk or phenotypically defined NUP98-HOXA10hd–transduced cells generated at the end of 10-day culture. TNCs indicates total nucleated cells. Filled bars indicate the number of HSCs (expressed as the means ± SEM) generated by day 10 in cultures of NUP98-HOXA10hd–transduced cells and the HSC content (± SEM) of phenotypically defined subsets [CD150+CD48−; CD150+CD48+; CD150−(CD48+CD48−)], as determined by limiting dilution CRU assay. (D) The distribution of the total NUP98-HOXA10hd–transduced HSCs generated in 10-day culture according to indicated phenotypes [CD150+CD48−; CD150+CD48+; CD150−(CD48+CD48−)]. Each subset was isolated by FACS and assayed for the HSC content by limiting dilution. Black area represents the HSC content (< 10% of the total) undetected by indicated phenotype(s).

