Figure 6.
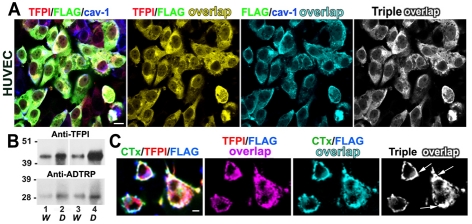
Localization of ADTRP and TFPI in caveolae/lipid rafts. (A) Immunofluorescence shows the distribution and colocalization of cell surface TFPI (Cy3, red) and FLAG (FITC, green) with Cav-1 (Cy5, blue; after permeabilization) on HUVEC stable expressing ADTRP-FLAG. Double and triple colocalization channels resulted from image analysis. (B) Representative Western blot with rabbit anti-ADTRP and anti-TFPI IgGs shows the partition of TFPI and ADTRP in the water (W, lanes 1 and 3) and detergent (D, lanes 2 and 4) cellular fractions after extraction with Triton X-114 and phase separation of control ECs (lanes 1 and 2) and stable ADTRP-expressing cells (lanes 3 and 4). (C) Immunofluorescence showing clustering and enhanced colocalization (triple overlap, white) of cell surface TFPI (Cy3, red) and FLAG (Cy5, blue) together with Cholera Toxin B (CTx)–FITC (green) after live incubation at 37°C of ADTRP-FLAG-expressing EC with CTx-FITC (ligand for the lipid raft marker GM1). Bars: 10 μm.

