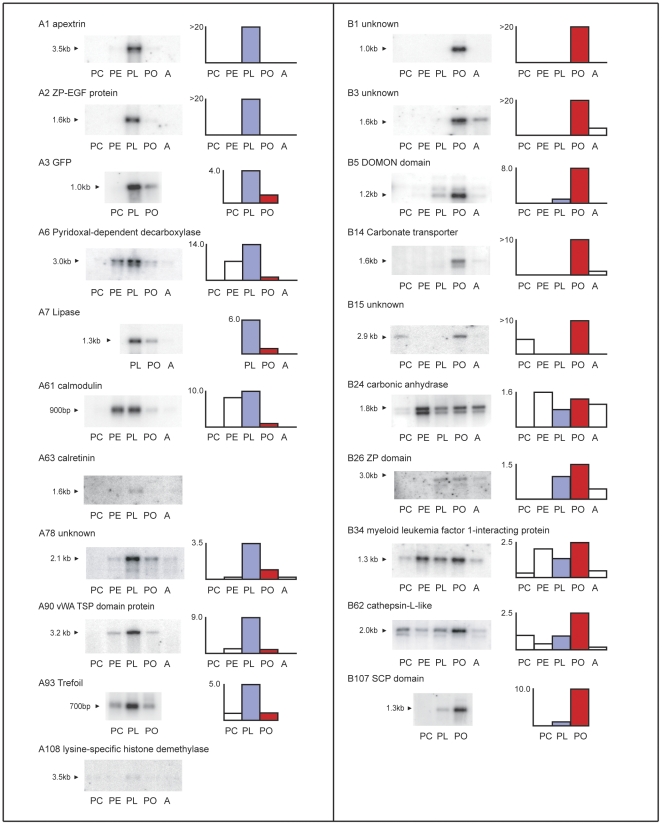
Figure 2. Virtual northern blots.
Virtual northern blots provide more detailed information as to the expression of transcripts identified by SSH. This figure is organized so that genes up-regulated pre-settlement are in the left column, arranged in the order of their occurrence in Table 1. Genes up-regulated post-settlement are in the right column, arranged in the order of their occurrence in Table 2. The virtual northern blots are shown on the left with the stages from which RNA was made, designated PC (for prawn chip, a pre-gastrulation stage), PE (for pear, a stage after the blastopore has closed and the spherical embryo has begun to elongate), PL (for pre-settlement planula, the elongate larval stage which may be of extended duration), PO (for the immediate post-settlement stage) and A (for the adult colony). The sizes of the detected transcripts are indicated beside the blots. Accompanying each blot is a quantitative diagram of signal intensity at the various stages, with the pre-settlement (PL) intensity shown in purple and the post-settlement (PO) intensity shown in red. Numbers on the ordinate indicate the ratio of PL to PO intensities for the pool A blots and of PO to PL intensities for the pool B blots.

