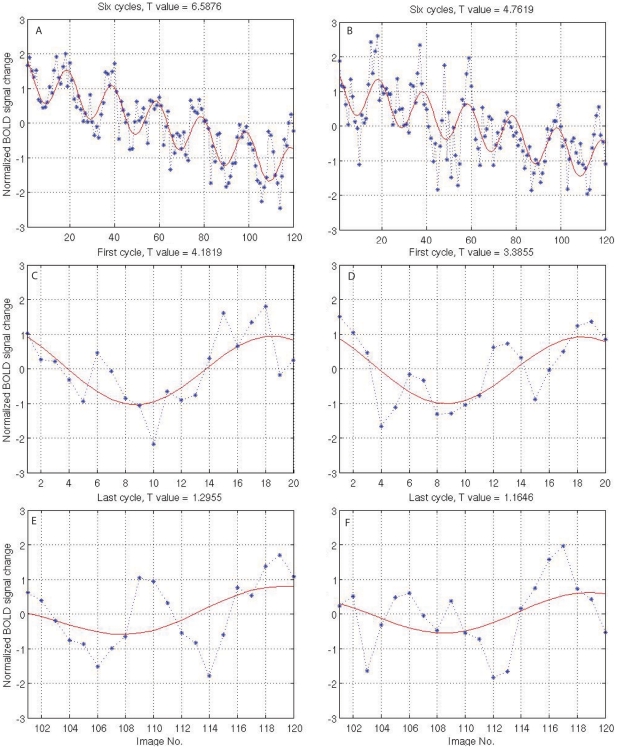
Figure 1. Two example fMRI response curves from an amblyopic subject (YC) at the same voxel position in V1 (right hemisphere).
A, C, and E are the response driven by the fixing eye; B, D, and F are the responses driven by the fellow amblyopic eye. A is the overall fMRI response driven by the fixing eye. B is the overall response driven by the amblyopic eye. C is the local response of the first cycle of A. D is the local response of the first cycle of B. E is the local response of the last cycle of A. F is the local response of the last cycle of B.

