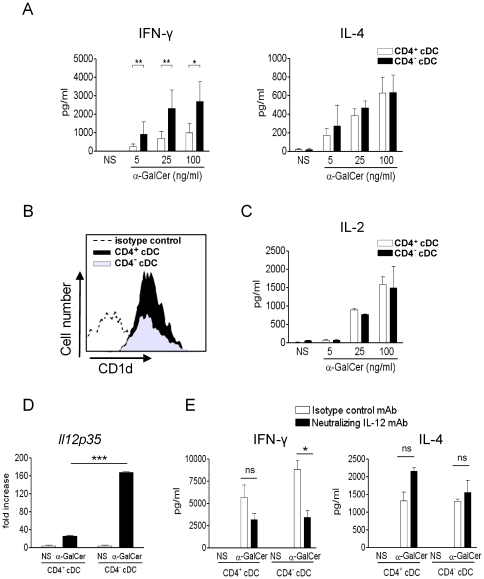
Figure 3. CD4+ and CD4− cDC differ in vitro in their capacity to activate iNKT cells.
(A, C) Sorted CD4+ and CD4− cDC were exposed to graded doses of α-GalCer and then co-cultured for 48 h with sorted iNKT cells (A) or with the iNKT cell hybridoma DN32.D3 (C). Cytokine production was quantified by ELISA. Results represent the mean ± SD of 3 (A) or 2 (C) independent experiments. (B) CD1d expression on CD4+ and CD4− cDC was assessed by flow cytometry. Of note, the staining with the isotype control was identical on both cDC subsets. For clarity, the isotype control on the CD4+, but not CD4−, cDC subset is shown. Shown is a representative experiment out of three. (D) Sorted CD4+ and CD4− cDC were exposed, or not (medium), to α-GalCer (100 ng/ml) and then co-cultured for 6 h with sorted iNKT cells. RNAs were prepared and IL-12p35 (Il12p35) mRNA copy numbers were measured by quantitative RT-PCR. Data are normalized to expression of Gapdh and are expressed as fold increase over average gene expression in vehicle-treated cDC. Of note, the basal level of IL-12p40 transcript in ex vivo sorted cDC is relatively elevated (Ct: 25–26) (Ct of gapdh: 20, Ct of il12p35: 31–32). Data represent the mean ± SD (triplicates) of an experiment out of two performed. (E) α-GalCer-loaded cDC subsets were co-cultured for 48 h with sorted iNKT cells in the presence of a neutralizing IL-12 Ab or an isotype control Ab. Shown is a representative experiment (mean ± SD) out of three performed. * p<0.05; ** p<0.01; *** p<0.001.

