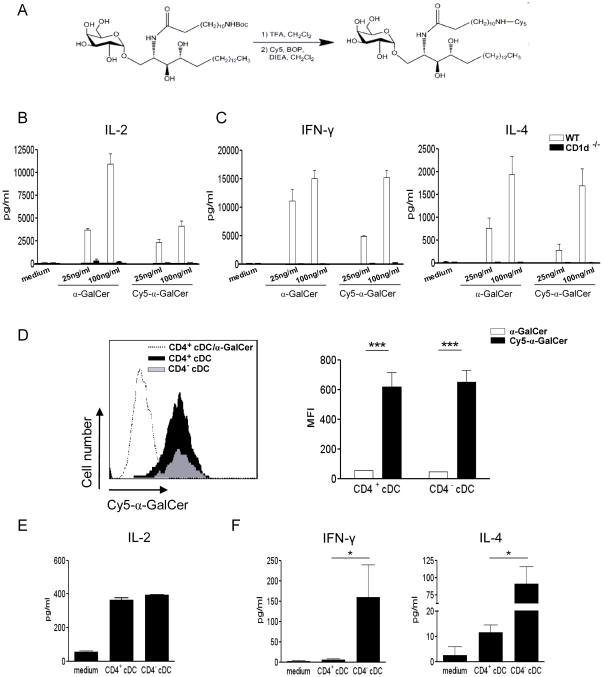
Figure 4. CD4+ and CD4− cDC equally capture α-GalCer in vivo but differ in their ability to activate iNKT cells.
(A) Representation of Cy5-conjugated α-GalCer synthesis. (B, C) Bone marrow-derived DC (105/well) from WT and CD1d−/− mice were loaded with unconjugated or Cy5-conjugated α-GalCer (25 and 100 ng/ml) and then co-cultured with either the iNKT cell hybridoma DN32.D3 (105/well) for 24 h (B) or with sorted primary iNKT cells (105/well) for 48 h (C). Cytokine production was quantified by ELISA. (D) Recipient mice were i.v. injected with Cy5-conjugated (20 µg), or unconjugated as a control (dotted line), α-GalCer and then Cy5 incorporation by CD4+ (black) and CD4− cDC (grey) was analyzed by flow cytometry 2 h later. Of note, both cDC subsets had similar profiles using unconjugated α-GalCer. For clarity, we only show the FACS profile for the CD4+ cDC subset. Shown are a representative histogram (left panel) and the MFI ± SD (right panel) of three independent experiments. (E, F) Mice were i.v. injected with α-GalCer (2 µg), cDC subsets were sorted 2 h later and co-cultured with the iNKT cell hybridoma DN32.D3 (E) or with sorted iNKT cells (F). Cytokine production was quantified by ELISA. Shown is a representative experiment out of three performed. * p<0.05; *** p<0.001.

