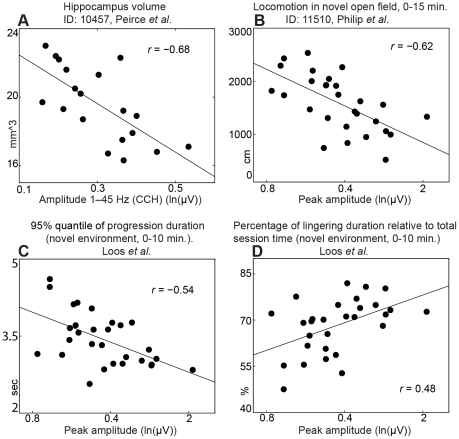
Figure 5. Amplitude of carbachol-induced oscillations shows prominent genetic correlations with hippocampal volume and locomotion traits.
Scatter plots of (A) amplitude 1–45 Hz versus hippocampus volume, and (B) peak amplitude versus locomotion in novel open field. More detailed analysis of locomotion revealed a negative correlation with the duration of progression segments (C), but a positive correlation with the duration of lingering segments (D). The black dots represent BXD strain means. IDs refer to the GeneNetwork database.

