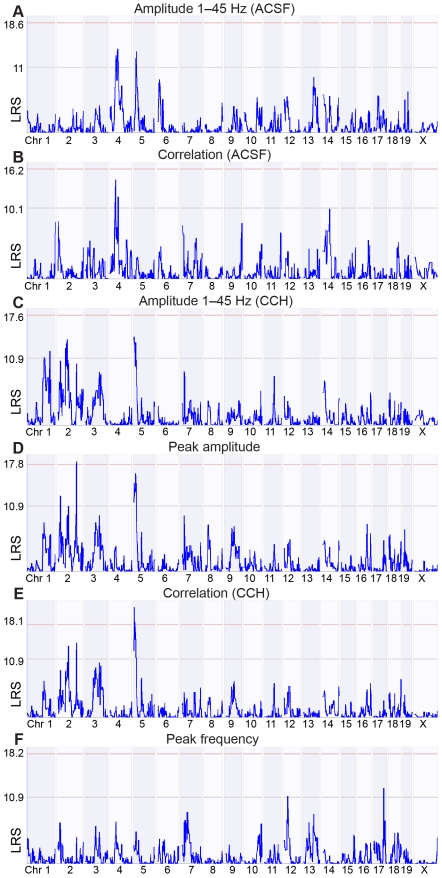
Figure 6. QTL mapping of six hippocampal activity traits peaks at 19 different locations.
The LRS scores (y-axis) quantify the relation between genomic markers (x-axis) and six traits. Integrated amplitude between 1 and 45 Hz at the ACSF (A) and carbachol (CCH) condition (C), peak amplitude (D) and frequency (F) at the carbachol condition, inter-regional correlation at the ACSF (B) and carbachol condition (E). The red horizontal lines indicate the threshold for significance (p = 0.05), whereas the grey lines indicate suggestive significance (p = 0.63). For the traits depicted here, we selected the 18 QTLs above the suggestive significance level and correlated the hippocampal traits with expression data of genes within these QTLs.

