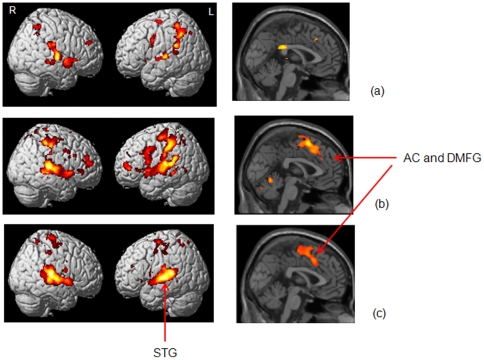
Figure 4. Statistical parametric maps of the discrimination task.
Statistical parametric maps of the discrimination task (DT>Rest) rendered on a template brain for (a) normal hearing, (b) hearing loss and (c) tinnitus with hearing loss groups are shown on the left. The sagittal sections shown are located at x = 0 for all groups are shown on the right. All reported clusters are p<0.05 FWE corrected for multiple comparisons at the voxel or cluster-level. Some clusters are highlighted in the figure - AC: anterior cingulate, DMFG: dorsomedial frontal gyrus, STG: superior temporal gyrus.

