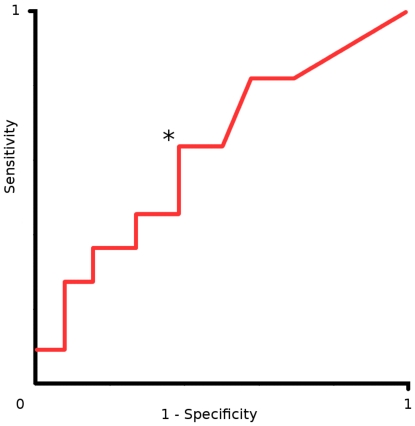
Figure 2. A receiver operator curve (ROC) was constructed to identify the fibrillation score cut-off that identified non-responders with the maximal sensitivity while preserving specificity.
Sensitivity is represented on the y axis and (1-specificity) on the x axis. The asterisk (*) indicates a fibrillation score of 0.4. A score>0.4 detected non-responders with moderate sensitivity (64%) and specificity (62%).

